This analysis was originally posted by Audit Analytics.
This is the first post of our Decade of Data series which will highlight our Europe databases containing ten years of data.
As mentioned in last week’s post, the Audit Analytics Europe Audit Fees database now contains audit fees dating back to 2010. A review of collected fees from the last ten years reveals a few interesting trends that may reflect the changes to statutory audits mandated by the European Union (EU) in the middle of the last decade.
In 2014, there were two significant pieces of legislation passed by the European Parliament related to statutory audits. Taking effect on June 17, 2016, Directive 2014/56/EU and Regulation (EU) No. 537/2014 were adopted in the wake of the Global Financial Crisis and had a significant impact on companies’ engagement of statutory auditors and provision of non-audit services within the EU. Both acts contain reforms designed to protect the integrity of statutory audits, as well as strengthen auditor independence.
The legislation directly impacted audit firms’ fees for various services in several ways. One component of the regulation was to prohibit the provision of certain non-audit services by statutory auditors and to cap auditors’ remuneration for many others. Given the timing of these reforms, a review of non-audit fees from 2010-2019 provides some insight into the trend before and after the new rules took effect in 2016.
First, we examined annual audit and non-audit fees as a percentage of total fees for each year from 2010-2019. Our European population includes companies listed on regulated and select unregulated exchanges in the EEA and Switzerland. For the purpose of this analysis, we excluded companies incorporated outside the EEA and Switzerland, resulting in 57,310 audit fee records from 6,956 companies. It should be noted that 2019 is a partial year, as most fiscal years end in December and this data is not yet available.
Also worth noting, audit related fees can be viewed as a component of audit fees or non-audit fees. For this reason, this analysis looks at non-audit fees both including and excluding audit related fees.
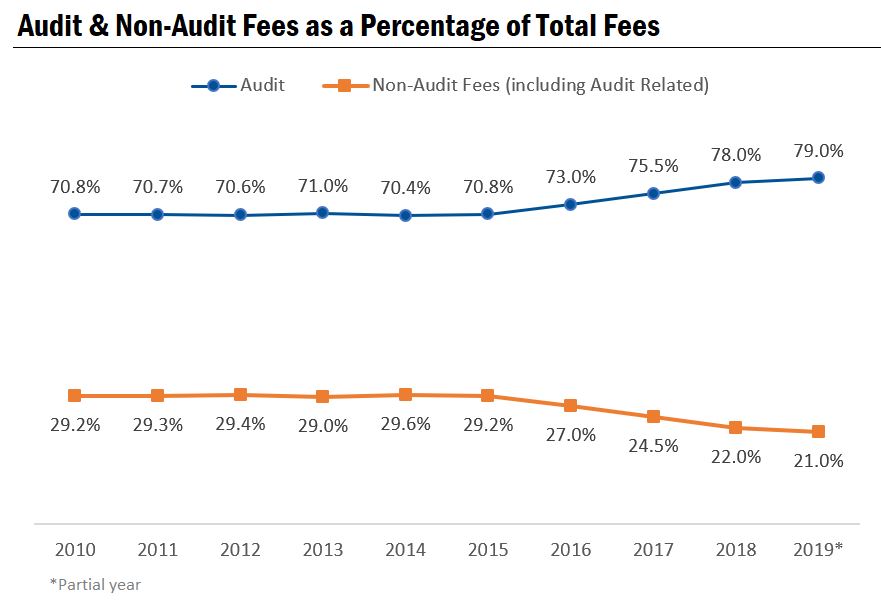
As shown below, there is a notable shift in the overall distribution of fees corresponding to the EU legislation related to statutory audits and independence.

From 2010-2015, prior to passing the reforms, fees for non-audit services (including audit related) hovered around 29% of total fees, peaking at 29.6% in 2014. In 2016 – the first fiscal year for which most of this legislation took effect in the EU – this percentage decreased to 27.0% and has continued to decrease each year since.
As of 2018, the most recent full year of data available, fees for non-audit services comprised 22.0% of total fees, a drop of 7.6% from the maximum in 2014.
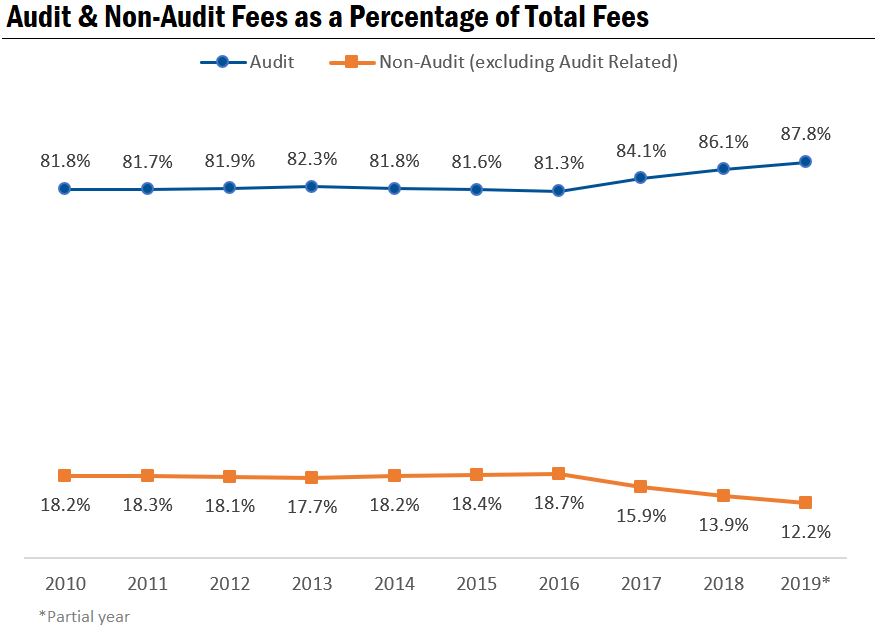
We observe a similar trend when grouping audit and audit related fees together, as shown below:

When excluding fees for audit related services, fees for non-audit services reached their maximum in 2016 at 18.7% before falling to a share of 13.9% in 2018.
The difference between the two graphs represents a slight contraction in the share of audit related fees over time. In both cases, non-audit fees as a percentage of total fees decreased after 2016. Currently, it appears that 2019 will also follow the trend of decreasing fees for non-audit services.
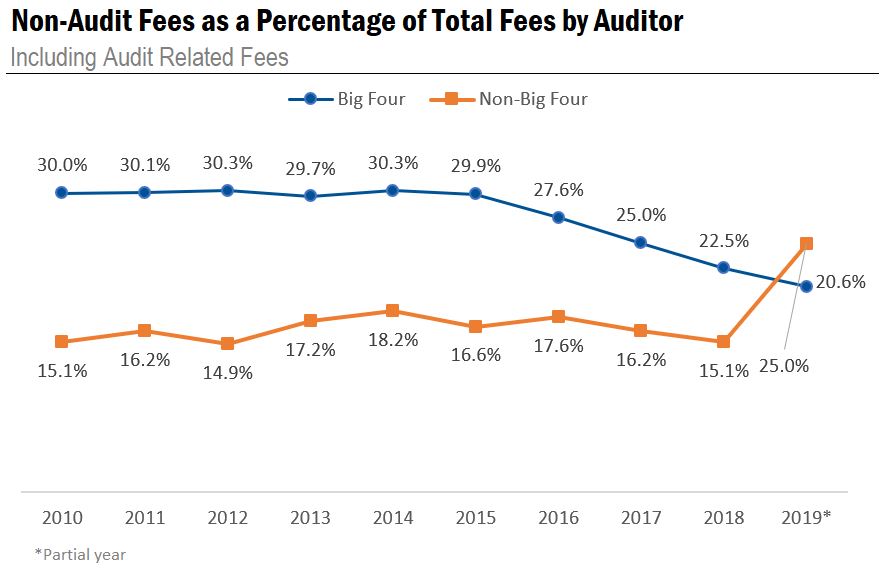
Next, we examined the proportion of non-audit fees to total fees by auditor. In this analysis, we separated the Big Four from all other firms.

In general, payments to the Big Four were more stable and had a higher proportion of non-audit fees overall.
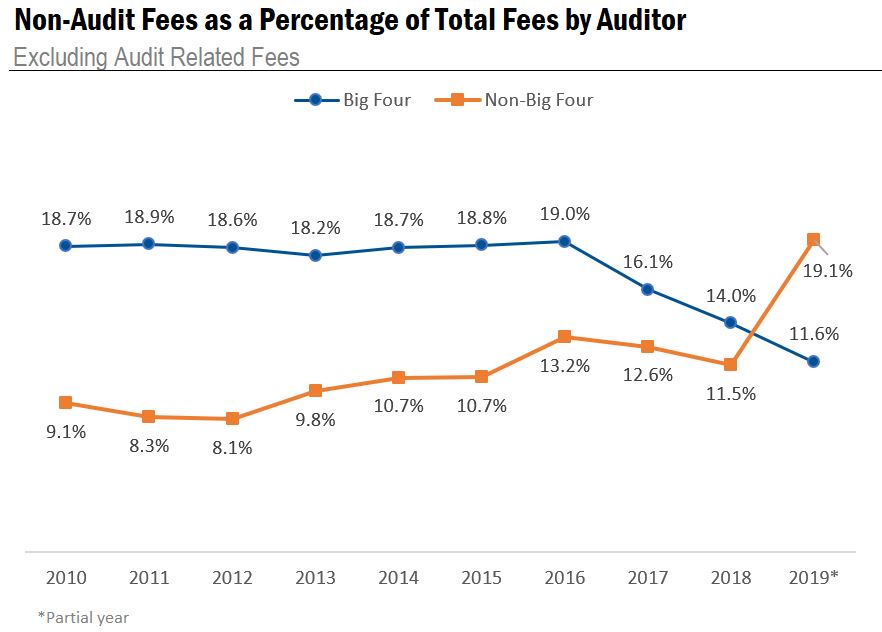
This trend persists when audit related services are excluded from the non-audit category:

Having ten years of data allows us to easily identify trends with audit fees both before and after the EU legislation went into effect in mid-2016; it’s apparent that this reform had a significant impact on audit fees.
We look forward to delivering other analyses powered by our Europe databases containing ten years of historical data. Don’t forget to check back for our next Decade of Data blog!
The analysis in this post was powered by the Audit Analytics Europe Audit Fees database.
For more information on any of these European databases, or to request a demo, please email info@auditanalyics.com.