“We vary the model specifications along manifold dimensions and find our main results to stay qualitatively similar” What does this (made up) sentence want to communicate to the academic reader? “Don’t worry, our results are robust”.
As everybody who works empirically with observational data is probably aware, assessing the robustness of empirical results is more an art than a science. Our research designs have so many degrees of freedom that it is virtually impossible to assess all of them. Then again, the review process often triggers questions about whether the findings at hand are sensitive to this and that variation. This in some cases leads to bloated papers and extensive (online) appendices that hardly anybody ever reads.
Can we do better? Yes we can! The open science movement is promoting the use of open data and open source code so that interested reviewers and researchers can assess the robustness of prior work in detail. Yet again, data is often proprietary or commercialized. Program code is non-trivial to port to different systems. In combination, this means a lot of boring and sometimes frustrating work just to validate that the findings hold.
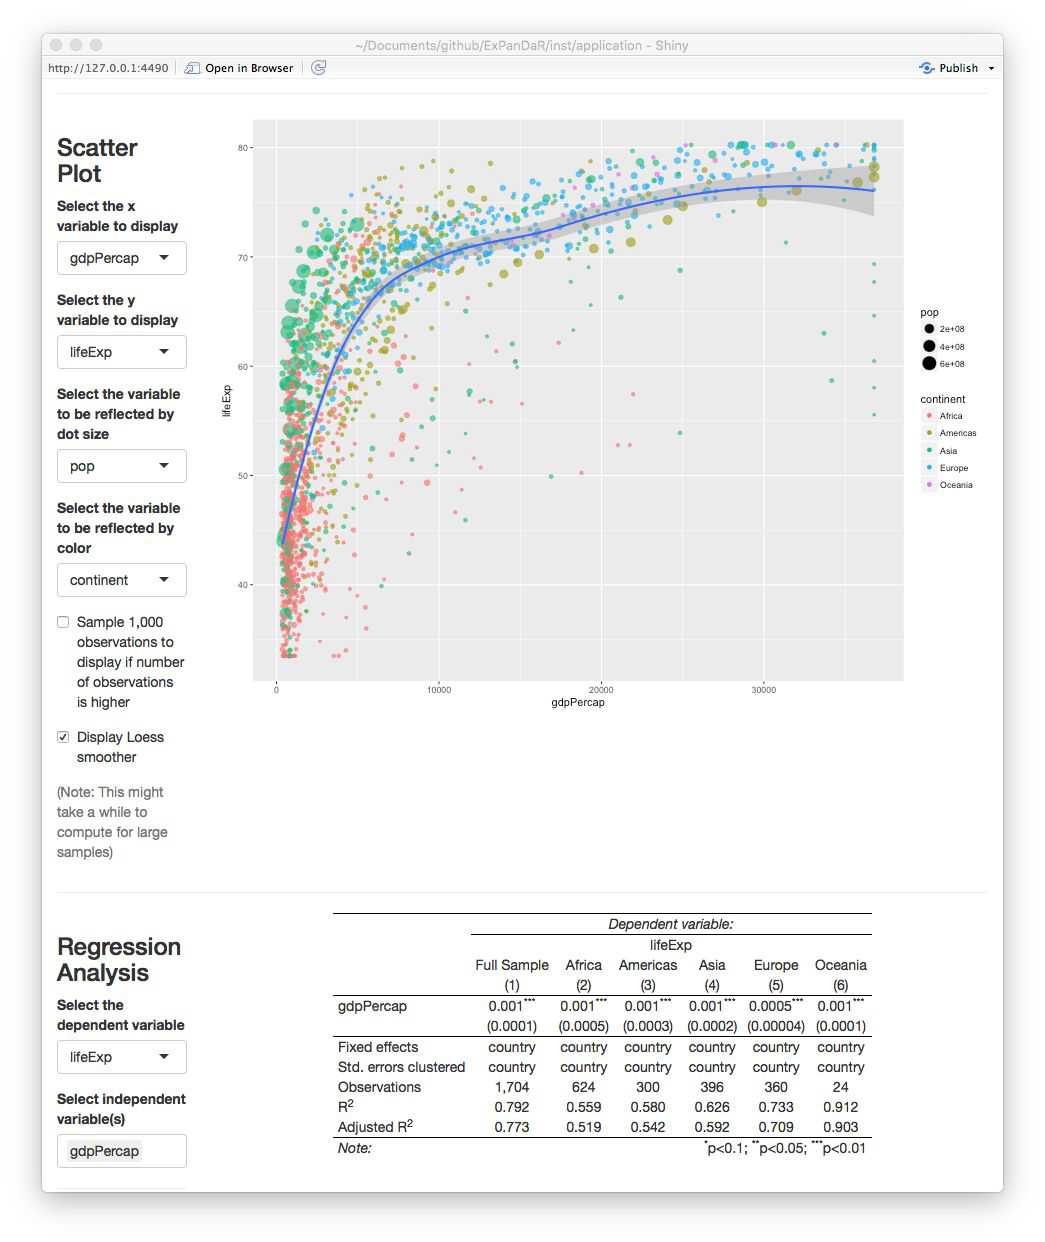
One of the fascinating current innovations in statistical software is the opportunity to prepare interactive data visualizations. For a current replication project, we developed the R package ExPanDaR (Explore Panel Data with R). It features the ExPanD app that allows users to explore panel data without providing them access to the underlying data. It offers a set of tools commonly used in exploratory data analysis so that readers can get a solid grip on the data.
This is what it looks like:

If you are interested to see what ExPanD has to offer without diving into R, click here to explore an instance of ExPanD that hosts World Bank data or click here for a financial accounting and stock returns dataset of U.S. firms.
If you want to analyze your own panel data instead, you can also access a variant of ExPanD app here that allows user-side data uploads. No worries: Your data won’t be stored on the server and will get erased from memory as soon as you close the web connection.
To see how ExPanD can be used to assess the robustness of empirical findings, click here for a current project where we explore the accrual landscape, building on the paper “The Changing Landscape of Accrual Accounting “ by Bushman, Lerman and Zhang (JAR, 2016).
You can find the full documentation of the ExPanDaR package, including its source code, here. I am very interested to hear what you think about this project. Feel free to comment or to get in touch directly.