This analysis was originally posted by Audit Analytics.
In a previous post, we looked at the Key Audit Matter (KAM) disclosures of more than 1,200 companies over the past three years and discussed some interesting trends. Now, just nine months later, Audit Analytics has added a significant amount of data, as our KAMs database now includes more than 30,000 KAMs from the audit opinions of over 4,250 companies.
The requirement to include Key Audit Matter (KAM) disclosures in audit opinions has been in full effect since 2014 in the UK and Netherlands, and since 2016 for the rest of the EEA and Switzerland.
KAMs are required under ISA 701 for fiscal years ending on or after December 15, 2016. Therefore, fiscal 2017 is the first full year of Key Audit Matter disclosures.
Since 2016, Audit Analytics has collected over 23,000 KAMs disclosed in more than 9,000 audit opinions, though some companies disclosed KAMs as early as 2010.
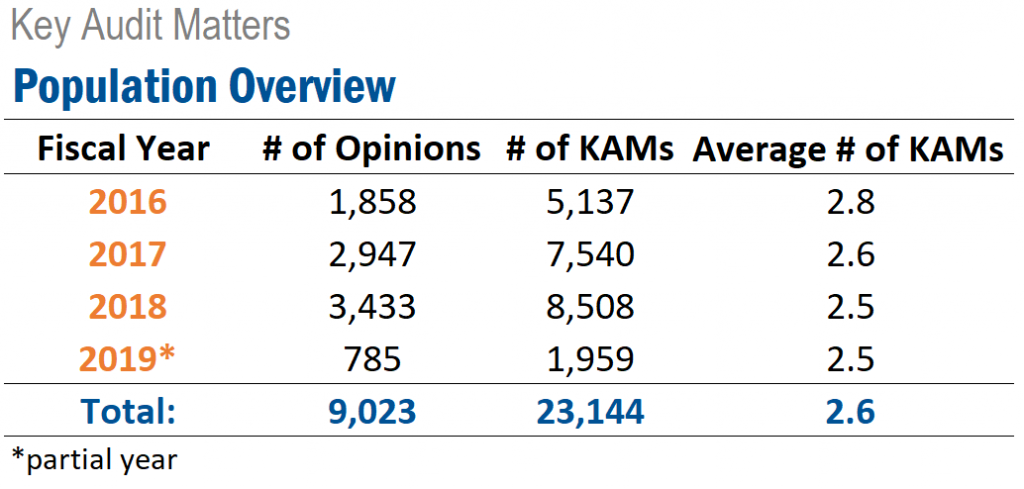
As shown in the table above, the average number of KAMs per audit opinion was about 2.8 in 2016. Since then, this number has slightly decreased over the years, to an average of 2.5 in both 2018 and 2019. However, it’s important to keep in mind that 2019 data is not yet complete.
Overall, the Big Four audit firms were relatively consistent with the number of KAMs per audit report, ranging from 2.5 to 2.7, with EY reporting the most KAMs and PwC reporting the least in 2018.
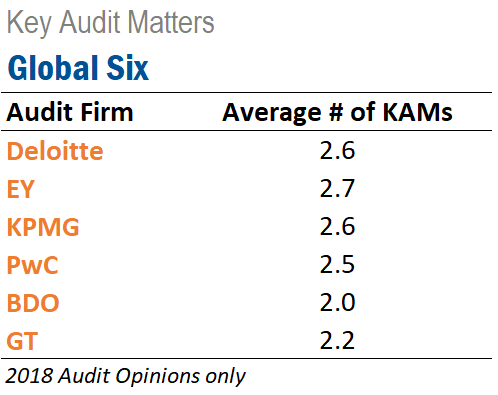
BDO and Grant Thornton averaged 2.0 and 2.2 KAMs per audit report, respectively – a decrease from our previous overview.
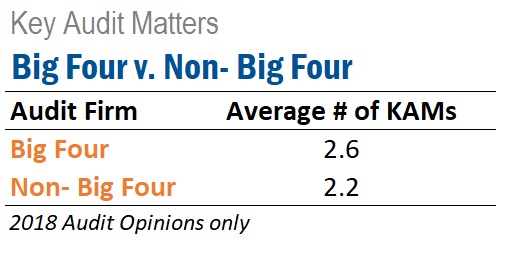
When comparing the Big Four with other non-Big Four audit firms, we noticed that Big Four firms include slightly more KAMs per audit opinion. On average, Big Four firms report 2.6 KAMs per audit opinion, while non-Big Four firms report 2.2 KAMs per audit opinion.
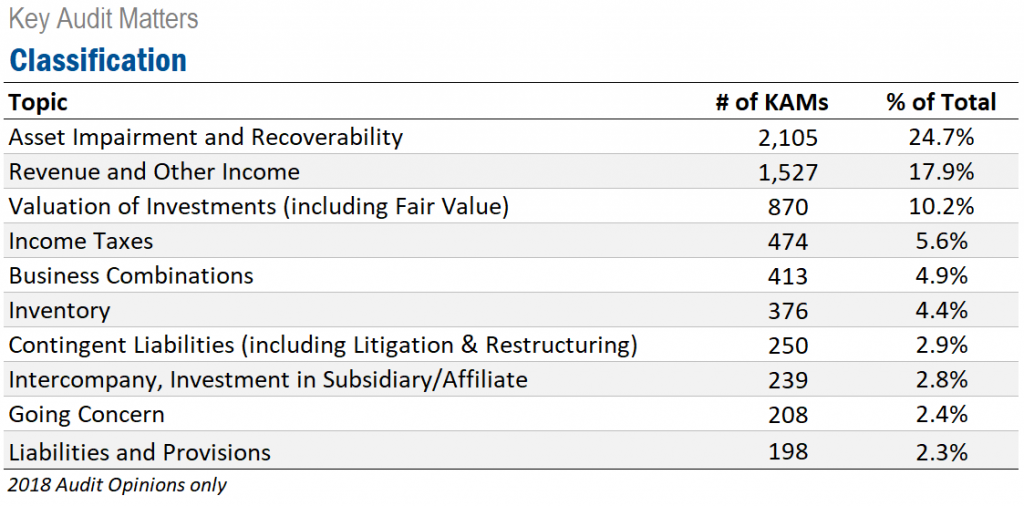
In 2018, Asset Impairment and Recoverability was unsurprisingly the most reported KAM, appearing in just under 25% of all KAMs. Revenue and Other Income and Valuation of Investments follow behind at nearly 18% and just over 10%, respectively. The order of the top seven KAM topics remained unchanged from last year. In 2018, both Going Concern and Intercompany, Investments in Subsidiaries/Affiliates topics cracked the top ten most common topics.
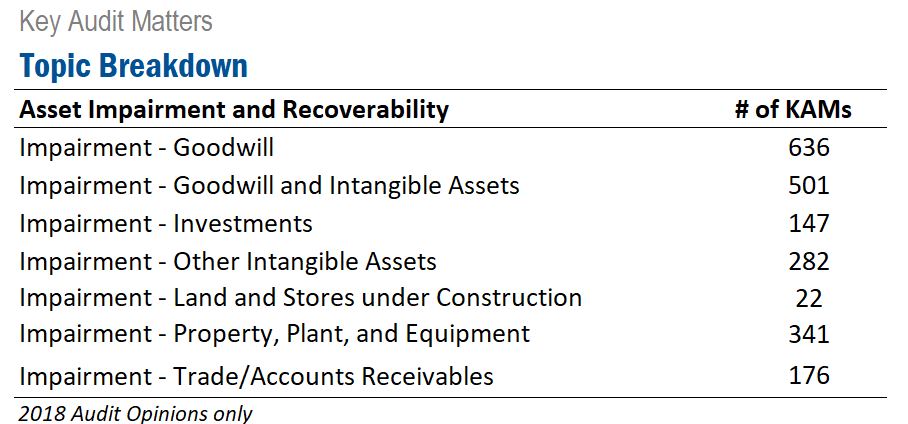
Expanding on the Asset Impairment and Recoverability topic, we see that 16.7% of all KAMs are related to the impairment of goodwill and/or intangible assets. Accounts receivables was added to the Asset Impairment and Recoverability classification topic, as shown in the chart below.
Looking at a more granular breakdown, the table below shows several types of investment valuations that are commonly reported, with securities and financial instruments being the most common.

Lastly, the table below displays the classifications by industry, based on the SIC top-level divisions. This presents the percentage of companies in select industries having at least one KAM citing one of the top ten classification topics. While there are differences in the percentages year-over-year, there has not been a significant change.

The analysis in this post was created using the KAMs database, powered by Audit Analytics. Audit Analytics tracks Key Audit Matters for auditors of EEA and Swiss equity listed entities, normalizes the topic of the KAM, records the text of the title and description, as well as the auditor’s response.
For more information on our KAMs database, or any of our European databases, please email info@auditanalytics.com.