This was analysis originally posted by Audit Analytics.
This is the second post of our Decade of Data series to highlight our Europe databases containing ten years of data.
The Audit Analytics Europe Opinion database currently contains over 64,000 audit opinion records from over 8,800 companies, encompassing 2010-present. With the majority of companies having a fiscal year end in December, these numbers will quickly increase over the next few months.
Using the data we have available, this post looks at auditor market share across Europe since 2010. Our European population includes companies listed on regulated and select unregulated exchanges in the EEA, UK and Switzerland.1
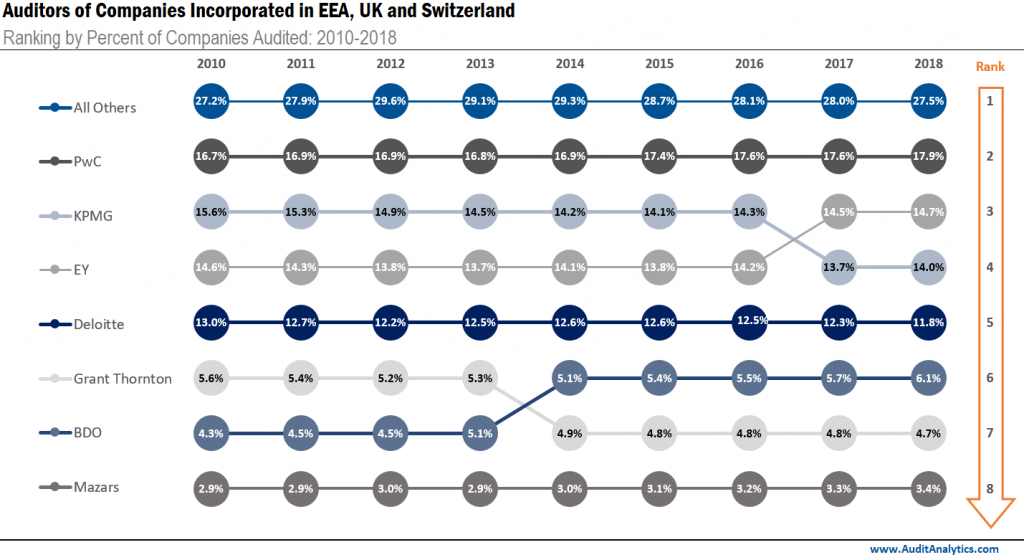
The chart below looks at the ranking of audit firms of companies incorporated in the EEA, UK and Switzerland. In total, 1,977 firms have competed for the market share of 8,042 companies since 2010. The 1,885 audit firms outside of the Big Four, Grant Thornton, Mazars, or BDO networks have been categorized as “All Others.” Together, these seven named networks consist of just 92 firms, or 4.7% of the total audit firms.

With a few exceptions, the firm rankings remain virtually the same from 2010-2018.
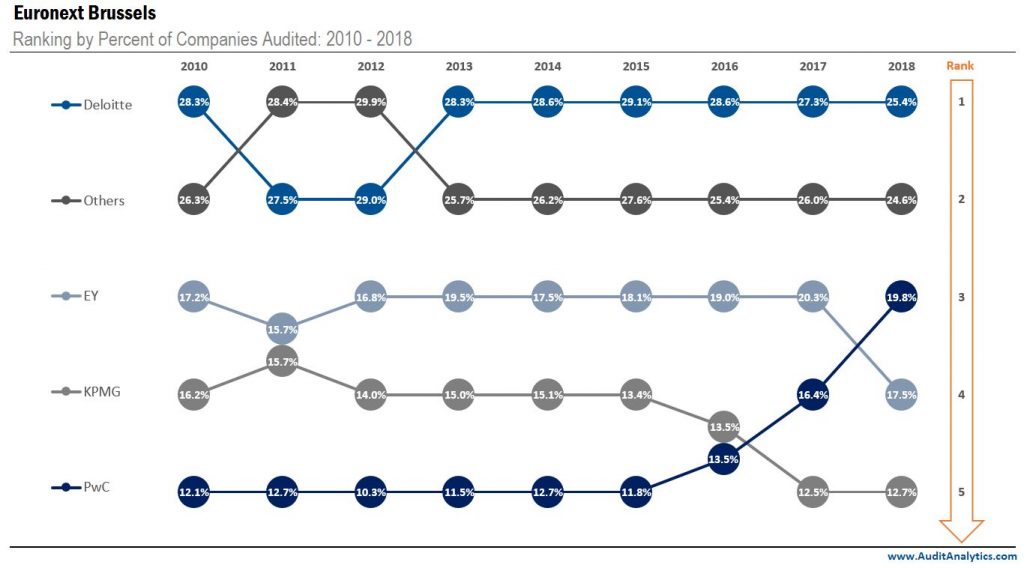
An analysis of auditors for all companies incorporated in the EEA and Switzerland provides an overall understanding of market share, though it can be beneficial to look at a more specific set of companies. To further illustrate the possibilities when analyzing market share, the chart below displays auditor concentration among companies listed on a specific exchange, in this case, Euronext Brussels.

Belgium allows an auditor to audit a public interest entity (PIE) for up to nine years without a public tender. “After this, the mandate of the statutory auditor can be renewed three more times (+ nine years) or six more times (+ 18 years), provided that a public tender process is organized or that another audit firm is appointed to work together with the existing firm as a “college”, respectively.” Therefore, it is not surprising that we see such little change.
“All Others”, as shown in this chart, represents between 23-27 audit firms (varying on the year) of companies traded on Euronext Brussels. Interestingly, Deloitte audits the most companies on this exchange, only falling second to these combined firms by less than 1% in both 2011 and 2012.
While examining auditor market share for all companies incorporated in the EEA and Switzerland and companies that are traded on a specific exchange provide more generalized overviews, looking at auditor concentration for particular indices can provide an even narrower view of market share.
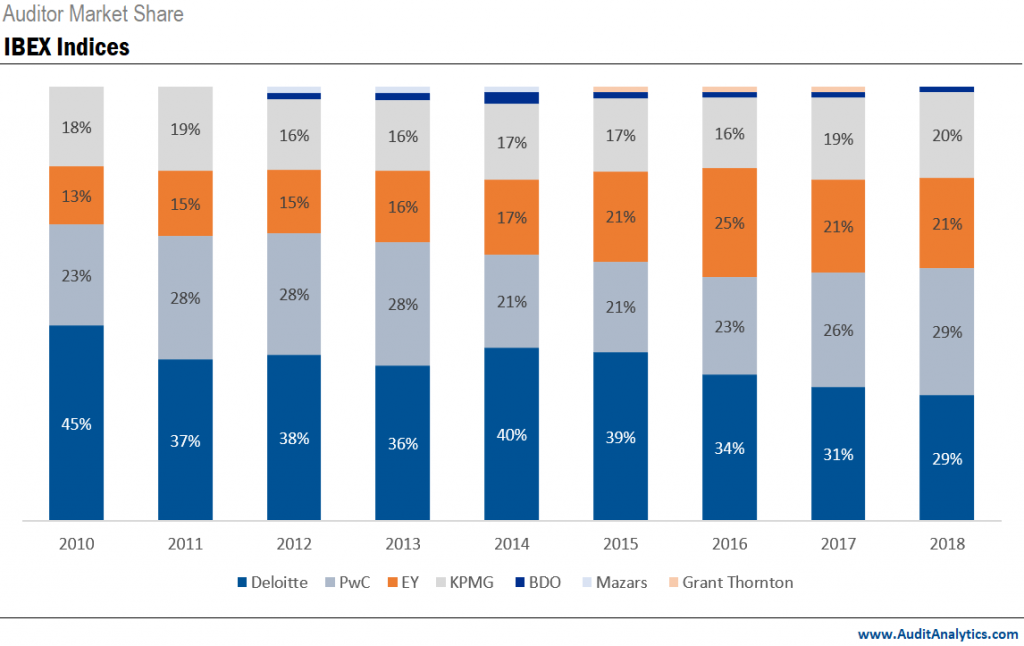
The chart below shows the auditor market share among Spain’s prominent indices – the IBEX 35, IBEX mid-cap and, IBEX small cap. Since 2010, about 650 audit opinions have been signed for companies on these indices, all of which were signed by only seven firms.

In both 2010 and 2011, the Big Four dominated this entire market. From 2012 on, other firms have had a share, though minimal in comparison to the Big Four. Another interesting observation: when one of the Big Four’s percentage drops, another of the Big Four’s percentage increases.
The graph also shows that among these seven audit firms, Deloitte consistently performs the most audits until 2018 when the number more aligns with PwC. One contributing factor may be Spain’s implementation of the EAR in July of 2015. “The majority of the provisions entered into force from the first financial year commencing on or after 17 June 2016.” Since the majority of the companies hold a fiscal year end in December, the effects would not be visible until 2017, which is where the graph slowly starts to even out among the Big Four.
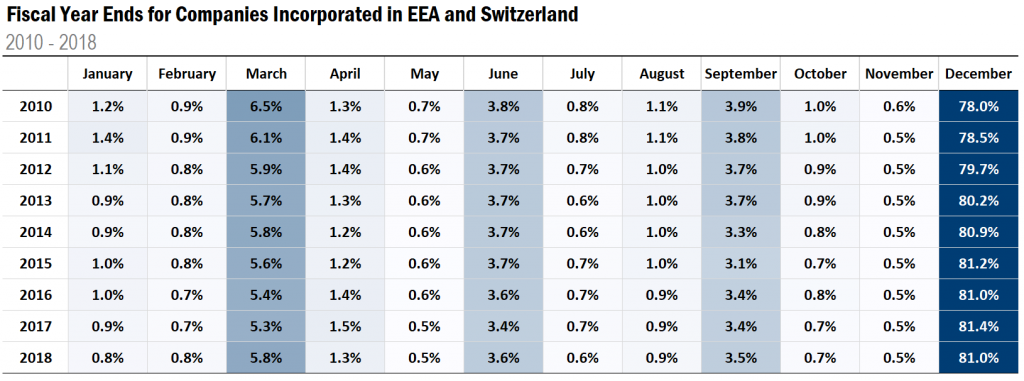
For companies with a calendar year-end fiscal year, the coming months are exceptionally busy for financial professionals. In the past, Audit Analytics has analyzed year-end dates for public companies. To see how busy this “busy season” is outside of the United States, our previous analysis was updated to specifically examine year-end dates for Canadian public companies, and we’ll use this opportunity to look at year-end dates for European companies.

Since 2010, fiscal year ends have remained consistent among European companies. Nearly 80% of companies in this analysis have a December year-end. March is the second most common, with an average of 6% of companies having a fiscal year end in this month.
The analysis in this post was powered by the Audit Analytics Europe Audit Opinions database.
For more information on any of our European databases, or to request a demo, please contact us.
1. 2019, being a partial year, was excluded from this analysis as opinions for companies with FYE 2019-12-31 are not yet available.
For the purpose of this analysis, we excluded companies incorporated outside the EEA, UK and Switzerland.