Envisioning a Sustainable Future: How Accounting Education is Rising to the Challenge
The call for a more sustainable world is reshaping industries—and the accounting profession is no exception. The recent EAA Education Committee Symposium in Rome, “Envisioning Accounting Education for Sustainability,” explored how accounting education can become a powerful force in addressing today’s ecological and climate crises. The event underscored the vital role of embedding sustainability at the heart of accounting curricula, with the aim of equipping future professionals to foster responsible practices and drive meaningful change. The symposium was designed to offer educators adaptable examples and to spark a ripple effect—from classrooms to boardrooms—worldwide.
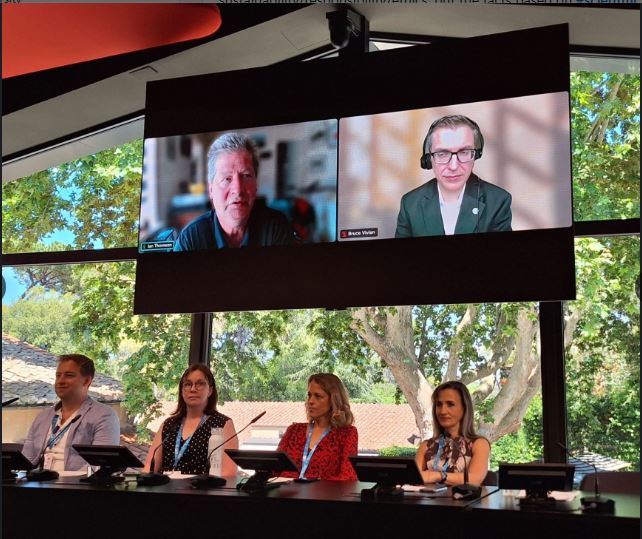
Moderated by David Derichs (Aalto University), the symposium brought together insights from Gaia Melloni (HEC Lausanne), Hanna Silvola (Hanken School of Economics), Ian Thomson (University of Dundee), and Bruce Vivian and Adriana Florina Popa (IFAC), with foundational preparations by Lisa Powell (Monash University).
The symposium recording is available here.
Cultivating the Accountant of Tomorrow: Essential Skills for a New Era
A central message of the symposium was that today’s complex global challenges require an expanded skillset from accounting graduates. Beyond technical expertise, future professionals must develop systems and integrated thinking to understand interdependencies across economic, social, and environmental domains. Adaptability and a commitment to lifelong learning were highlighted as essential traits in a fast-evolving world.
The discussions emphasized how international education standards are increasingly recognizing these broader competencies. These include strategic decision-making, risk and opportunity analysis, collaboration in multidisciplinary environments, and strong communication and behavioral skills. The ability to analyze diverse forms of data—from sustainability metrics to scenario analysis and value chain impacts—is now indispensable. Moreover, understanding the implications of sustainability on reporting and assurance practices, grounded in a robust ethical foundation, is critical.
Weaving Sustainability into the Fabric of Accounting Education
The symposium spotlighted a wide range of practical strategies for integrating sustainability into accounting education. Panelists described how sustainability topics have evolved from peripheral mentions to core components of the curriculum, including standalone courses at both undergraduate and graduate levels.
Pedagogical approaches reflected a shift toward constructivist, student-centered learning, often anchored in real-world relevance through case studies, guest lectures, and impact-driven teaching methods. Examples from different countries showcased how co-teaching, active learning formats, and close collaboration with industry stakeholders can make sustainability more tangible and actionable for students. Systematic initiatives—such as national ESG certification programs or mandatory SDG courses—demonstrate how institutions can embed sustainability comprehensively across business education.
Navigating the Journey: Guidance for Educators
The transition to sustainability-integrated curricula is not without challenges. Participants acknowledged the difficulties educators may face, particularly in institutions or regions where sustainability is not yet prioritized. However, they shared key principles to support educators at all stages of the journey.
These included ensuring pedagogical alignment between learning objectives, teaching methods, and assessment. Educators were encouraged to embrace the evolving nature of sustainability topics rather than shy away from their complexity. Most importantly, maintaining a purpose-driven mindset—centered on the broader impact of education—can inspire both teachers and learners to engage meaningfully with the topic.
The contributions of organizations such as IFAC, through updates to the International Education Standards, provide further support by outlining the skills and competencies needed for this educational transformation.
Shaping a More Responsible Future
The EAA Education Committee Symposium served as a catalyst for rethinking the role of accounting education in today’s world. By thoughtfully redesigning curricula and embedding sustainability as a central concern, accounting educators have the opportunity to prepare the next generation of professionals to lead with purpose. This collective effort can shape a more accountable, responsible, and sustainable future for all.